Information-Theoretic Approach to Prioritize Data for Post-Disaster Survey

With the popularity of sensor-equipped mobile devices, a huge amount of multimedia data, e.g., text, image, audio, video is being generated at unprecedented scale. Harnessing this data for humanitarian efforts, such as disaster response has recently become popular. In disaster response, data triage – prioritizing data collection and data analysis is a crucial phase in disaster response as the generated data, either by human or sensor) is not only large in amount but also noisy.

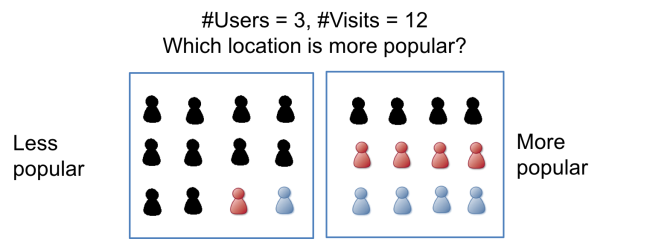
A popular approach is to prioritize the data based on the importance (i.e.,  the urgency of having the data and further understand it). Thereafter, the important data will be analyzed first, either by human or machine, to make sense out of it. An alternative approach that we proposed in our recent study [1] is to prioritize the data based on the uncertainty of whether or not the data would enhance the situational awareness during disaster, quantified by information entropy. The reason for using uncertainty as the measure of priority is that if the probability of a bridge being damaged is 99%, we are certain about this event and thus not willing to allocate resources (i.e., human) for interpreting the data (i.e., satellite images of the bridge) associated with the bridge. Instead, it makes more sense to spend more resource to analyze the data that we are uncertain about, i.e., the image of a bridge with 50% chance of being damaged.

In [1], we proposed a framework to assess post-disaster data by giving higher priority to the data that contains more information (larger uncertainty).  Thus by assessing the high-priority data first, the framework quickly reduce the total uncertainty of the disaster over time. We evaluated the framework in a case study of inspecting bridges after the 2011 Nisqually earthquake. The results show the superiority of our framework when compared to the current surveying method.

[1] Sasan Tavakkol, Hien To, Seon Ho Kim, Patrick Lynett, and Cyrus Shahabi, An Entropy-based Framework for Efficient Post-disaster Assessment Based on Crowdsourced Data, The 2nd Workshop on Emergency Management using GIS (EM-GIS 2016), San Francisco, USA, October 2016

Differentially Private Publication of Location Entropy

Location entropy (LE) is an eminent metric for measuring the popularity of various locations (e.g., points-of-interest). It has applications in various areas of research, including multi-agent systems, wireless sensor networks, geosocial networks, personalized web search, image retrieval and spatial crowdsourcing. Location entropy can be used to capture the intrinsic diversity of a location without necessarily looking at the functionality of that location (e.g., is it a coffee shop or a private home? is it an airport terminal? is it a park or museum?). To illustrate LE, the figure below shows two locations with the same number of users and the number of visits. Which one do you think is more popular Intuitively, the second location is more popular because all users frequently visit the location as opposed to the first location where the black user visits most of the times.

Picture1.png

Current solutions for computing LE (or location popularity in general) require full access to the past visits of users to locations, which has serious privacy concerns. Thus, in our recent study [1], we proposed a set of techniques based on differential privacy to publish location entropy from raw location visit data without violating users’ location privacy. Our technique would enable data aggregators such as Google, Microsoft and Apple to share their data with many industries and organizations (e.g., academia, CDC) in the form of aggregated or processed location data for the greater good, e.g., research, prevent the spread of disease.

Furthermore, we envision the data aggregators such as Google to use location entropy in two ways. First, location entropy can be used as a metric to find popular locations from location data. Our techniques help to publish such popular locations with high entropy to third parties without violating users’ location privacy, e.g., Niantic could use the published popular locations as PokeStops in the Pokemon Go game. Second, Google may use location entropy as the measure of privacy, in which Google would only reveal a location on a user’ behalf only if the location is a popular place (quantified by location entropy). Instead of directly using location entropy, our techniques add noise to its actual value so that an attacker is not able to reliably learn whether or not a particular user is present in the original data.

[1] Hien To, Kien Nguyen, and Cyrus Shahabi, Differentially Private Publication of Location Entropy, In Proceeding of the 24th ACM SIGSPATIAL International Conference on Advances in Geographic Information Systems (SIGSPATIAL 2016), San Francisco, CA, USA, October 31 – November 3, 2016

An Empirical Study of Workers’ Behavior in Spatial Crowdsourcing

We performed a spatial crowdsourcing experiment with more than 238 real users in two separate campaigns (one with fixed rewards and one with increasing rewards). Particularly, we designed a Genkii app that allows users to obtain a monetary reward for reporting their mood / sentiment and rewarded taskers through the Yahoo Japan Crowdsourcing payment platform. We then analyzed the responses to identify the effects fixed vs. increasing rewards, the effects of mobility, temporal patterns, retainment analysis, etc. Our findings in this study are three-fold.

We first report the worker performance during the two campaigns. We obtained a total of 1059 reports from both campaigns, out of which 436 reports were from the first campaign and 623 reports from the second. We observe an “on-boarding effect” in both campaigns in which 40% of the users (with at least one report) made only one report. At the same time, 24% of the users are considered active, who made at least 10 reports. We also observed peak numbers of reports during pastimes in Japan (4, 12 and 20) and the least number of reports during commute times (1, 9 and 17).

Second, we compared user participation in the two reward strategies (i.e., how well a user is retained in our 10-task campaign). Our analysis shows that the overall user participation decreases significantly in both campaigns, among which the drop rate is less in the increasing reward campaign. Particularly, the largest drop rate is between the first and the second reports. This result shows that workers are motivated by growing incentives to stay in the campaign. In addition, with the increasing reward campaign, 17% of the users finish the 10-task campaign while this number is only 11% with the fixed reward campaign.

Third, we studied worker mobility from the reporting locations. We categorized Genkii users with at least six reports based on their mobility. Each worker has a certain degree of mobility defined as the area of the minimum bounding rectangle that encloses all the reporting locations, which is highly correlated with his/her commuting pattern. We observed that 75% of the workers travel within 500 square km. This result suggests that users tend to contribute data in the proximity of their homes. In addition, users are more likely to report Happy mood if they commute long distances named “Commuter”, while the ones who travel short distances, the so-called “House Dweller” have a large fraction of Dull reports.

Hien To, Ruben Geraldes, Cyrus Shahabi, Seon Ho Kim, and Helmut Prendinger, An Empirical Study of Workers’ Behavior in Spatial Crowdsourcing, Third International ACM SIGMOD Workshop on Managing and Mining Enriched Geo-Spatial Data, San Francisco, CA, USA, June 26 – July 1, 2016

Mining User-Generated Videos

With the popularity of mobile cameras, a huge amount of user-generated videos is generated every day. This big data can be used for various purposes, e.g., surveillance, news, disaster response, augmented reality. However,  one of the biggest issue with user-generated videos is that their content very often not interesting or useless, e.g., a user randomly records video around his/her location. Therefore, there is a need to quickly search for interesting/significant videos for a particular application.

In augmented reality (AR), we are interested in video contents that are appealing to AR users. Leveraging rich spatial metadata of user-generated videos (e.g., camera location, camera direction), the user-generated videos can be precisely registered on AR browsers, e.g., Layar, Wikitude, and Junaio. Using such metadata, we can search for a sequence of video segments that follow a particular camera shooting pattern, e.g, zooming, tracking, arching and panning. These shooting patterns is a strong indicator of an interesting video (i.e., the video is recorded with a specific purpose rather than randomly record).

Screenshot 2016-05-17 08.28.55

We developed efficient algorithms to search for these camera shooting patterns from the spatial metadata of the videos. We test the algorithms on a user-generated video dataset [1] and found a subset of videos segments that are interesting. We verified their interestingly/significance by watching them. We also found that tracking is the most popular way of capturing mobile videos while arching is the least popular.

This study [2] is a first step to understand user-generated videos from their geospatial metadata.

[1] Ying Lu, Hien To, Abdullah Alfarrarjeh, Seon Ho Kim, Yifang Yin, Roger Zimmermann, and Cyrus Shahabi, GeoUGV: User-Generated Mobile Video Dataset with Fine Granularity Spatial Metadata, In the 7th ACM Multimedia Systems Conference (MMSys), Klagenfurt am Worthersee, Austria, May 10-13, 2016

[2] Hien To, Hyerim Park, Seon Ho Kim, and Cyrus Shahabi, Incorporating Geo-Tagged Mobile Videos Into Context-Aware Augmented Reality Applications, The Second IEEE International Conference on Multimedia Big Data (IEEE BigMM 2016), Taipei, Taiwan, April 20-22, 2016

Incorporating Geo-Tagged Mobile Videos Into Context-Aware Augmented Reality Applications

In recent years, augmented reality (AR) is gaining much attention from  the research community and industry. With AR, users look at the real-world space through an AR browser where the content is superimposed on the physical world as objects. AR is even regarded as the next-generation of web browser. However, there are challenges with popularizing AR usage. There is not enough AR content because creating the content is not only time-consuming but also  expertise-required. Thus, by leveraging the availability of big user-generated mobile content, we propose to incorporate geo-tagged mobile videos into AR applications. With our framework, any user can generate AR contents.

To enhance user’s experience, we focus on context-aware AR solution using rich-censored data including location (from GPS) and direction (compass). We propose filtering algorithms to effectively select a set of most interesting video segments out of a large video dataset so that the selected scenes can be automatically retrieved and displayed in AR applications. For the filtering, we define an interesting video segment as a sequence of video frames that follow a particular pattern (borrowed from film studies), including tracking, panning, zooming, and arching scenes.

We developed a demo regarding the integration of AR and geo-tagged user-generated mobile videos, conducted experiments to find interesting video segments from a large collection of videos, which mostly contains non-interesting content.

Source code

https://github.com/infolab-usc/mediaq-analytics

References

Hien To, Hyerim Park, Seon Ho Kim, and Cyrus Shahabi, Incorporating Geo-Tagged Mobile Videos Into Context-Aware Augmented Reality Applications, The Second IEEE International Conference on Multimedia Big Data (IEEE BigMM 2016), Taipei, Taiwan, April 20-22, 2016

SCAWG: A Toolbox for Generating Synthetic Workload for Spatial Crowdsourcing

Existing studies in mobile crowdsourcing (aka spatial crowdsourcing), a hot research area in recent years, face the problem of lacking real­world datasets. We thus published a synthetic dataset generator for producing common datasets for mobile crowdsourcing.

The toolbox can generate synthetic workload patterns based on the spatial (location) and temporal (time) distributions of workers and tasks. As shown in the figure below, it also takes into account the various real-world constraints, such as worker region and worker capacity, worker activeness and temporal workload.

toolbox

Link to the toolbox

https://github.com/infolab-usc/SCAWG

References

Hien To, Mohammad Asghari, Dingxiong Deng, and Cyrus Shahabi, SCAWG: A Toolbox for Generating Synthetic Workload for Spatial Crowdsourcing, In Proceeding of International Workshop on Benchmarks for Ubiquitous Crowdsourcing: Metrics, Methodologies, and Datasets (CROWDBENCH 2016), Sydney, Australia, March 14-18, 2016

Real-Time Task Assignment in Hyper-Local Spatial Crowdsourcing under Budget Constraints

The author proposes an interesting and novel paradigm called the HyperLocal Spatial Crowdsourcing, which does not require workers to physically travel to the task locations. The proposed paradigm is more realistic, and the collected data is more trustworthy compared with the assumptions adopted in existing works [1,2,3,4]. In the Figure below, worker A is eligible to report data for both tasks, represented by two circles.

The spatial crowdsourcing framework

We study how to maximize task coverage under budget constraints in the presence of dynamic arrival of tasks and workers in location-aware crowdsourcing. The goal of the paper is to maximize the number of assigned tasks where a given number of workers can be selected over a time period, under a budget constraint. We consider dynamic cases where the number of tasks and workers are not known a priori. Two problem variants are investigated: one with a given budget for each time period, and the other with a given budget for the entire campaign.

References

Hien To, Liyue Fan, Luan Tran, and Cyrus Shahabi, Real-Time Task Assignment in Hyperlocal Spatial Crowdsourcing under Budget Constraints, In Proceeding of IEEE International Conference on Pervasive Computing and Communications (PerCom 2016), Sydney, Australia, March 14-18, 2016

Book recap – Don’t make me think

“Don’t make me think” is a great book for acquiring basic understanding of UI design. I “recap” here my favorite quotes from the books.

  1. we don’t read web, we scan them
  2. we don’t try to figure out how things work, we muddle through
  3. things that are related logically also related visually
  4. web conventions/formats are your friends
  5. make it obvious what is clickable
  6. wide v.s deep site hierarchies tradeoff. but generally, users don’t mind a lot of clicks as long as each click is painless and they have continued confidence that they’re on right track
  7. eliminate instructions entirely by making everything self-explanatory, or as close to it as possible
  8. similarity bwn web navigation and how people find directions in Stores
  9. web navigation conventions, search, home, bookmarks are useful
    1. persistent navigation includes: site id, home, search, utilities (i.e., How to Buy), sections (i.e., News, Products, Downloads)
    2. spell out the scope of search to avoid confusion, e.g., Search for a Book. You can provide search options
  10. every page need a name, needed to be in right place, needs to be prominent and the name is matched what you clicked
  11. showing “you are here” by marker, breadcrumbs (show the path from homepage to where you are) , breadcrumbs should be at top
  12. tabs are good for large sites b/c they are self-evident, hard to miss, clickable…
  13. Trunk test
    • what site is this? site id
    • what page I am on? page name
    • what are the major sections of this site? sections
    • what are my options at this level? local navigation
    • where am I in the scheme of things? you are here
    • how I can search?
  14. Designer vs. developer arguments
    • Moving the discussion away from the realm of what’s right or wrong into the realm of what works or doesn’t work
  15. What do you test?
    1. What do they like/love?
    2. How does it fit into their lives?
    3. What works well?
    4. How hard is it to do key tasks?
    5. Do they get the point of the site?
    6. Does it seem like what they need?
    7. Do they get the navigation?
    8. Can they guess where to find things?
    9. Pay more attention to actions and explanations than opinions as opinions during user tests are notoriously unreliable
  16. Typical tests problems
    1. Users are unclear of the concept
    2. The words they are looking for aren’t there
    3. There is too much going on